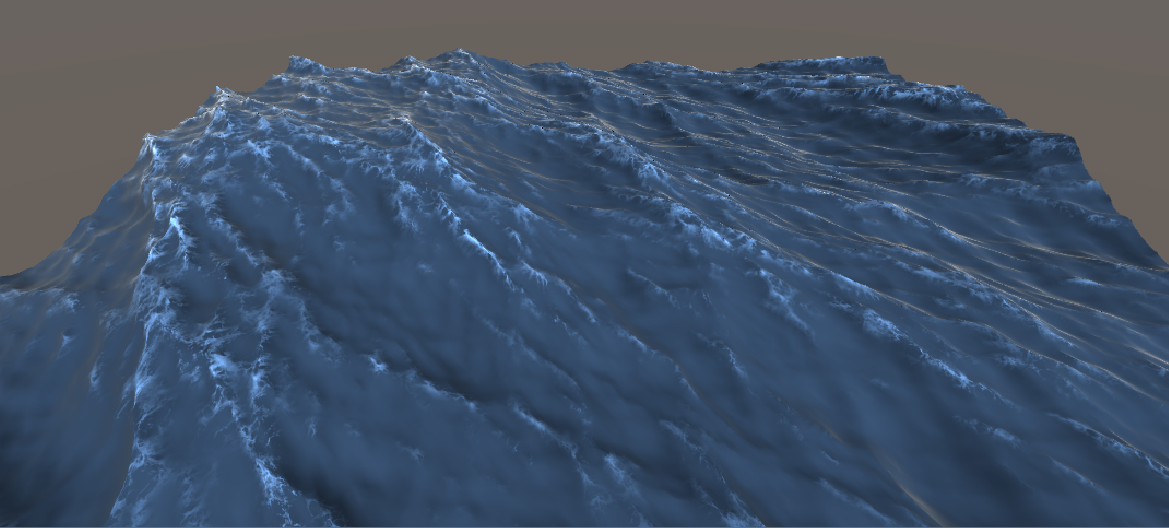
Figure 1: Simulated water surface with a realistic surface shader on a 256x256 grid with a total size of 100 meters.
Source code: antoniospg/UnityOcean.
Introduction
In this project, I implement the statistical wave model from Tessendorf’s paper [1] on simulating ocean water. The technique generates a heightmap by summing a vast number of waves using the Fast Fourier Transform, with user-controllable size and resolution, and the result can be tiled seamlessly over a larger domain.
The main idea is that the ocean can be modeled very well as a sum of “infinite” waves with different amplitudes traveling in different directions. These waves aren’t chosen at random; they come from statistical-empirical models of the ocean based on oceanographic research. In this post, I show how to recreate and animate the ocean surface and add visual features like foam and illumination.
Waves and the Fourier Transform
The technique consists of taking an inverse Fourier transform of the ocean height field in the frequency domain to get its spatial representation at each time \(t\). Every frame, for each pair \((x, z)\) in a rectangular grid, we compute the \(y\) component of that point, which is the ocean height at that location.
Given the height field in the spatial frequency domain, \(\tilde h(\mathbf{k}, t)\), we recover the spatial function with the inverse Fourier transform, that is, by evaluating the integral below:
\[\int_{-\infty}^{\infty} \tilde h(\mathbf{k}, t) \exp(i\,\mathbf{k} \cdot \mathbf{x}) \, d\mathbf{k}\]To compute it, we sample the signal over a discrete support domain, so the integral becomes a sum:
\[h(\mathbf{x}, t) = \sum_{\mathbf{k}} \tilde h(\mathbf{k}, t) \exp(i\,\mathbf{k} \cdot \mathbf{x})\]where \(\mathbf{k}\) is the wave vector, defined as:
\[\mathbf{k} = (k_x, k_z), \qquad k_x = \frac{2\pi n}{L_x}, \qquad k_z = \frac{2\pi m}{L_z}\]with:
\[-\frac{N}{2} \leq n \leq \frac{N}{2}, \qquad -\frac{M}{2} \leq m \leq \frac{M}{2}\]For most of the implementation, though, we work with indices \(i\) and \(j\) in a different range:
\[0 \leq i < N, \qquad 0 \leq j < M\]so we make the change of variables:
\[n = i - \frac{N}{2}, \qquad m = j - \frac{M}{2}\]The FFT produces the height field at the discrete points:
\[\mathbf{x} = \left( \frac{n L_x}{N}, \frac{m L_z}{M} \right)\]Finally, writing the 2D sum in terms of \(i\) and \(j\):
\[h(x, z, t) = \sum_{i=0}^{N-1} \sum_{j=0}^{M-1} \tilde h\!\left(i - \tfrac{N}{2},\, j - \tfrac{M}{2},\, t\right) \exp\!\left( \frac{i \pi x (2i - N)}{L_x} + \frac{i \pi z (2j - M)}{L_z} \right)\]The FFT
Computing the sum above directly costs \(O(n^2)\) for a 1D transform, which is terrible, especially for 2D data in a real-time system. The Fast Fourier Transform does the same computation in \(O(n \log n)\) for 1D data. The algorithm is intricate, but in essence a radix-2 FFT recursively splits the data in half and uses the cyclic property of the \(n\)-th roots of unity to avoid redundant work. Below is an example for 1D data with eight elements; the shape of this graph is why the FFT is also called the “butterfly algorithm”.
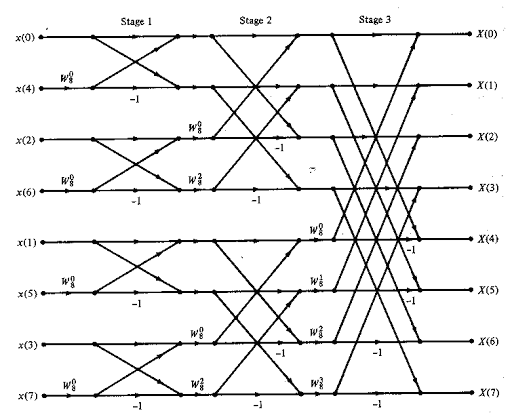
Figure 2: Butterfly algorithm.
How big should the grid be? It depends on whether you run the calculations on the GPU or the CPU. On the GPU, especially in a compute shader, the massive parallelism makes them much faster, and a 128x128 grid is enough for real time. On the CPU, the resolution is much more limited: in my implementation, 64x64 was the best I could get.
Statistical wave model
A height field realization can be seen as a sum of sinusoids with complex, time-varying amplitudes. Like any signal, it can be generated from its Fourier coefficients:
\[h(\mathbf{x}, t) = \sum_{\mathbf{k}} \tilde h(\mathbf{k}, t) \exp(i\,\mathbf{k} \cdot \mathbf{x})\]The coefficients are given by:
\[\tilde h(\mathbf{k}, t) = \tilde h_0(\mathbf{k}) \exp(i \omega(\mathbf{k}) t) + \tilde h_0^*(-\mathbf{k}) \exp(-i \omega(\mathbf{k}) t)\]where:
- \(\tilde h_0(\mathbf{k})\) is the initial value at \(t = 0\).
- \(\tilde h_0^*(-\mathbf{k})\) is the complex conjugate of \(\tilde h_0(-\mathbf{k})\).
- \(\omega(\mathbf{k})\) is the dispersion relation, \(\omega(k) = \sqrt{g k}\), where \(k\) is the length of the wave vector.
This equation animates the waves over time. The conjugate term propagates waves “to the left” and “to the right”. The dispersion relation links the wave vector to the frequency and comes from real physical models of ocean water.
Next we need the initial spectrum. For that we use an oceanographic model for its average value:
\[P_h(\mathbf{k}) = \left\langle |\tilde h^*(\mathbf{k}, t)|^2 \right\rangle\]For \(P_h\) we choose a semi-empirical model from oceanographic research known as the Phillips spectrum:
\[P_h(\mathbf{k}) = A \frac{\exp\left(-1/(kL)^2\right)}{k^4} \left| \hat{\mathbf{k}} \cdot \hat{\mathbf{v}} \right|^2, \qquad L = \frac{v^2}{g}\]To suppress waves smaller than some length \(l \ll L\), multiply the Phillips spectrum by:
\[\exp\left(-k^2 l^2\right)\]where:
- \(A\) is a numeric constant.
- \(\mathbf{k}\) is the wave vector.
- \(g\) is the gravitational constant.
- \(\mathbf{v}\) is the wind velocity.
Realizations of water height fields are observed to be Gaussian random numbers with spatial spectra of a prescribed form, and this is most efficiently done directly in the Fourier domain. The Fourier amplitudes of a height field can be produced by:
\[\tilde h_0(\mathbf{k}) = \frac{1}{\sqrt{2}} (\xi_r + i \xi_i) \sqrt{P_h(\mathbf{k})}\]where \(\xi_r\) and \(\xi_i\) are independent draws from a Gaussian distribution with mean 0 and standard deviation 1.
With all of that, we get the first version of the ocean surface:
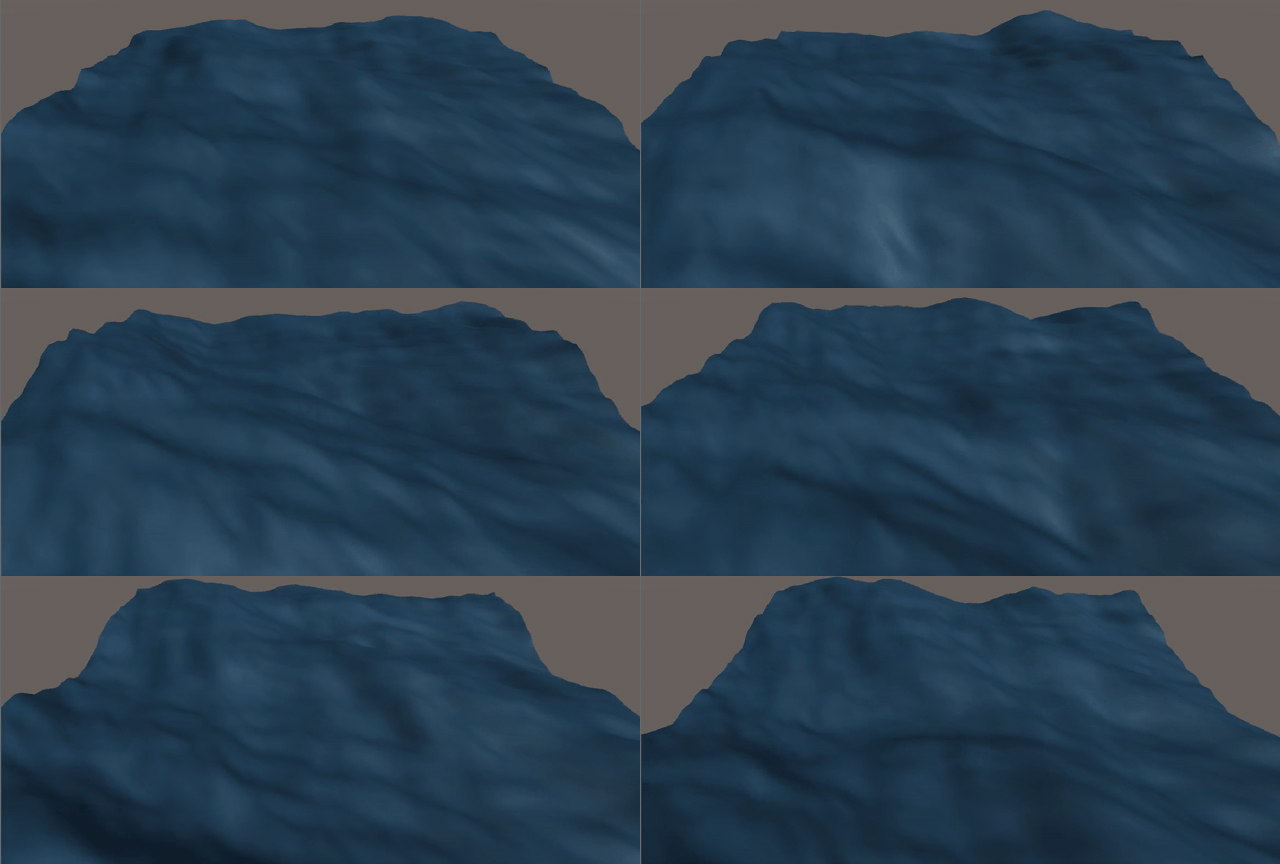
Figure 3: First simulation, using only the height field.
Additional calculations
Normals
Lighting needs the surface normal at each point. Instead of running another FFT, we save work by taking central differences over the height field to get its gradient \(\boldsymbol{\epsilon}(\mathbf{x}, t) = \nabla h(\mathbf{x}, t)\). The normal then follows from:
\[\hat{\mathbf{n}}(\mathbf{x}, t) = \frac{\hat{\mathbf{y}} - \boldsymbol{\epsilon}(\mathbf{x}, t)}{\sqrt{1 + \epsilon^2(\mathbf{x}, t)}}\]Horizontal displacement
At this point the waves have rounded peaks, which don’t look like a real ocean. To sharpen them, we also compute horizontal displacements. Ocean waves don’t only oscillate in \(y\); they oscillate horizontally too. To capture this, we decompose the spectrum along the \(x\) and \(z\) axes, giving a horizontal displacement:
\[\mathbf{D}(\mathbf{x}, t) = \sum_{\mathbf{k}} -i \frac{\mathbf{k}}{k} \tilde h(\mathbf{k}, t) \exp(i\,\mathbf{k} \cdot \mathbf{x})\]We then add it to the original grid positions. The user-controllable factor \(\lambda\) sets how strong the horizontal displacement is, that is, how sharp the waves get:
\[\mathbf{x}_f = \mathbf{x} + \lambda \mathbf{D}(\mathbf{x}, t)\]Here is the result of applying the displacement to the waves:
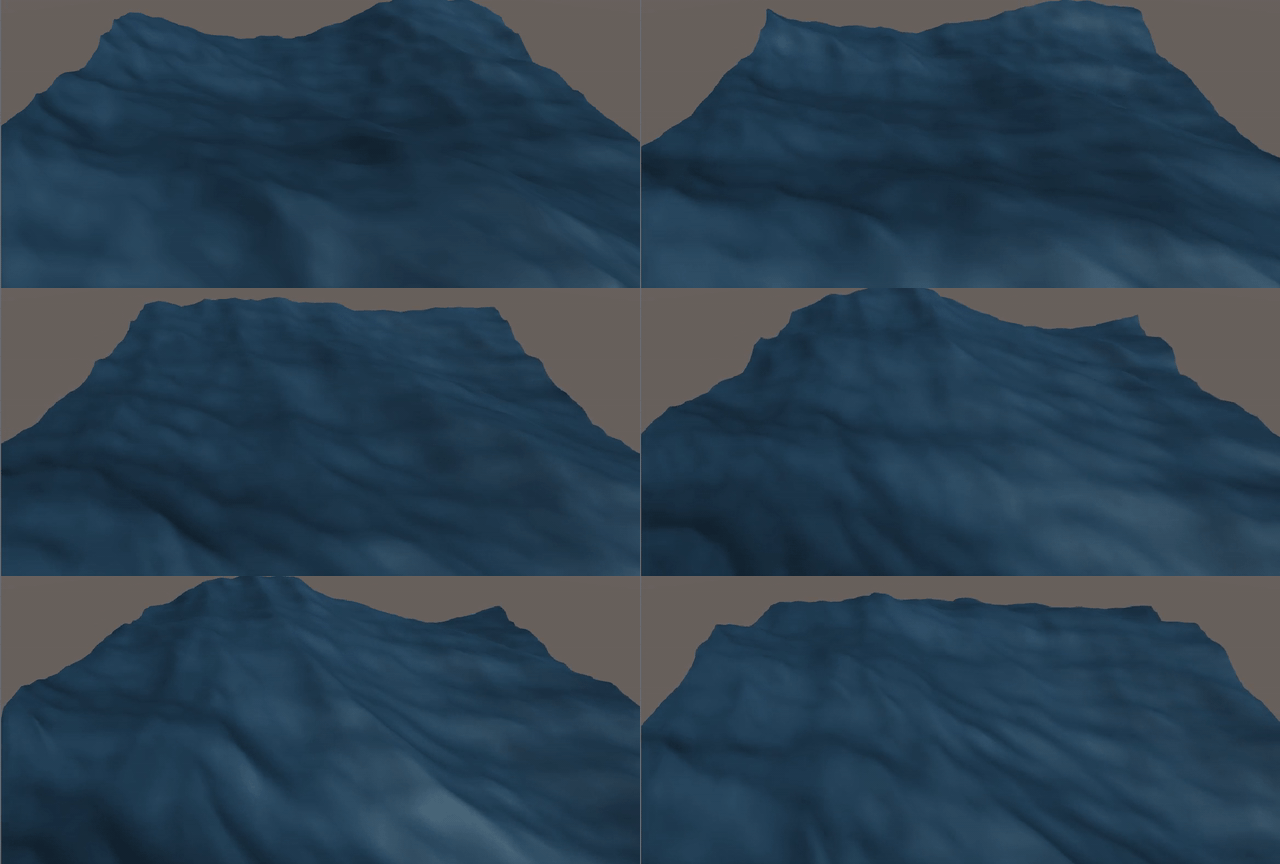
Figure 4: Simulation with horizontal displacement.
Ocean effects
Foam
To place foam, we need to know where the waves fold into themselves. A good measure is the Jacobian of the displacement map: it tells us whether the transformation is unique. When \(J = 0\), two grid points get mapped to the same position, so the Jacobian tells us where the waves fold, and we want to put foam wherever \(J \leq 0\).
\[\begin{aligned} J_{xx} &= 1 + \lambda \frac{\partial D_x(\mathbf{x})}{\partial x} \\ J_{zz} &= 1 + \lambda \frac{\partial D_z(\mathbf{x})}{\partial z} \\ J_{xz} = J_{zx} &= \lambda \frac{\partial D_x(\mathbf{x})}{\partial z} \\ J(\mathbf{x}) &= J_{xx} J_{zz} - J_{xz} J_{zx} \end{aligned}\]To apply the foam, we compute a folding map that masks a custom foam texture. The mask is a texture with one pixel per grid point. Then, for every position, we compute the foam intensity:
\[I = \operatorname{clamp}\left(0, 1, M - J(\mathbf{x})\right)\]This clamps \(M - J(\mathbf{x})\) between zero and one. Rather than drawing foam only where \(J \leq 0\), it works better to pick a custom threshold and draw foam where \(J < M\), using \(M - J(\mathbf{x})\) as the intensity. Figure 5 shows how the surface behaves for different values of \(J\).
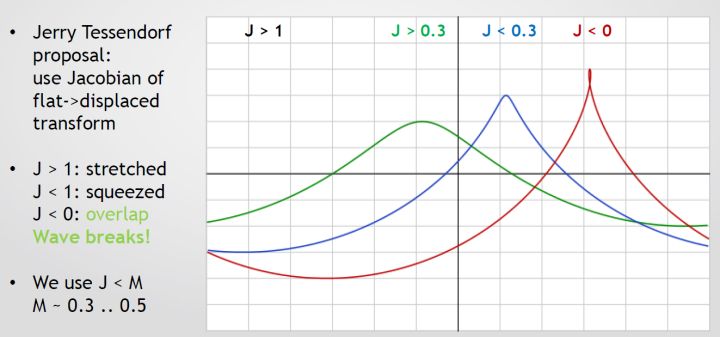
Figure 5: Points with different values of \(J\) [2].
Below, the folding map (left) modulates a custom foam texture (right); the result is multiplied into the ocean’s final color.
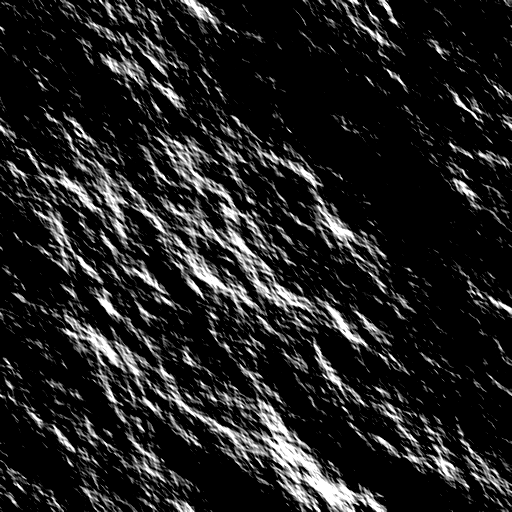 ×
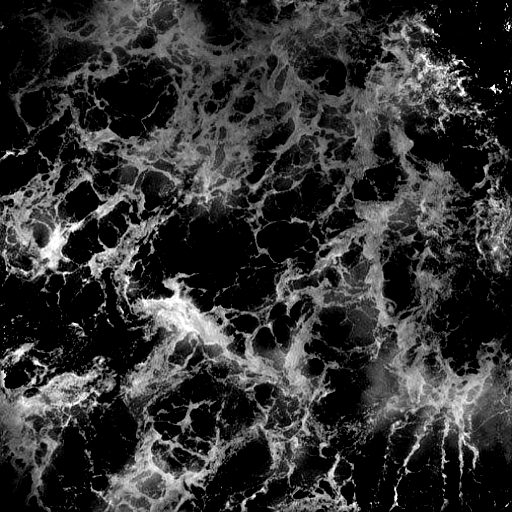
Figure 6: Folding map modulating a custom foam texture.
Illumination
The minimum lighting effects an ocean surface needs are reflection and refraction. In computer graphics, these are quantified by the reflectivity \(R\) and transmissivity \(T\), given by the Fresnel equations for s-polarized light:
\[R + T = 1\] \[R(\theta_i, \theta_t) = \left( \frac{n_1 \cos\theta_i - n_2 \cos\theta_t}{n_1 \cos\theta_i + n_2 \cos\theta_t} \right)^2\]where:
- \(\theta_i\) is the incident angle.
- \(\theta_t\) is the transmitted angle.
- \(n_1\) is the index of refraction of air.
- \(n_2\) is the index of refraction of water.
\(\theta_i\) and \(\theta_t\) are related by Snell’s law:
\[n_1 \sin\theta_i = n_2 \sin\theta_t\]\(R\) and \(T\) lie in \([0, 1]\), so they can be read as the fractions of the final color coming from reflected sky light and from light refracted out of the water volume. Since \(R \in [0, 1]\), we can use it to interpolate between the sky color and the ocean color:
\[C_f = \operatorname{lerp}(\text{OceanColor}, \text{SkyColor}, R)\]Evaluating the full Fresnel term per point is too expensive, so we use Schlick’s approximation instead:
\[R_0 = \left( \frac{n_1 - n_2}{n_1 + n_2} \right)^2, \qquad R(\theta) = R_0 + (1 - R_0)(1 - \cos\theta)^5\]Applying this in the ocean shader gives:
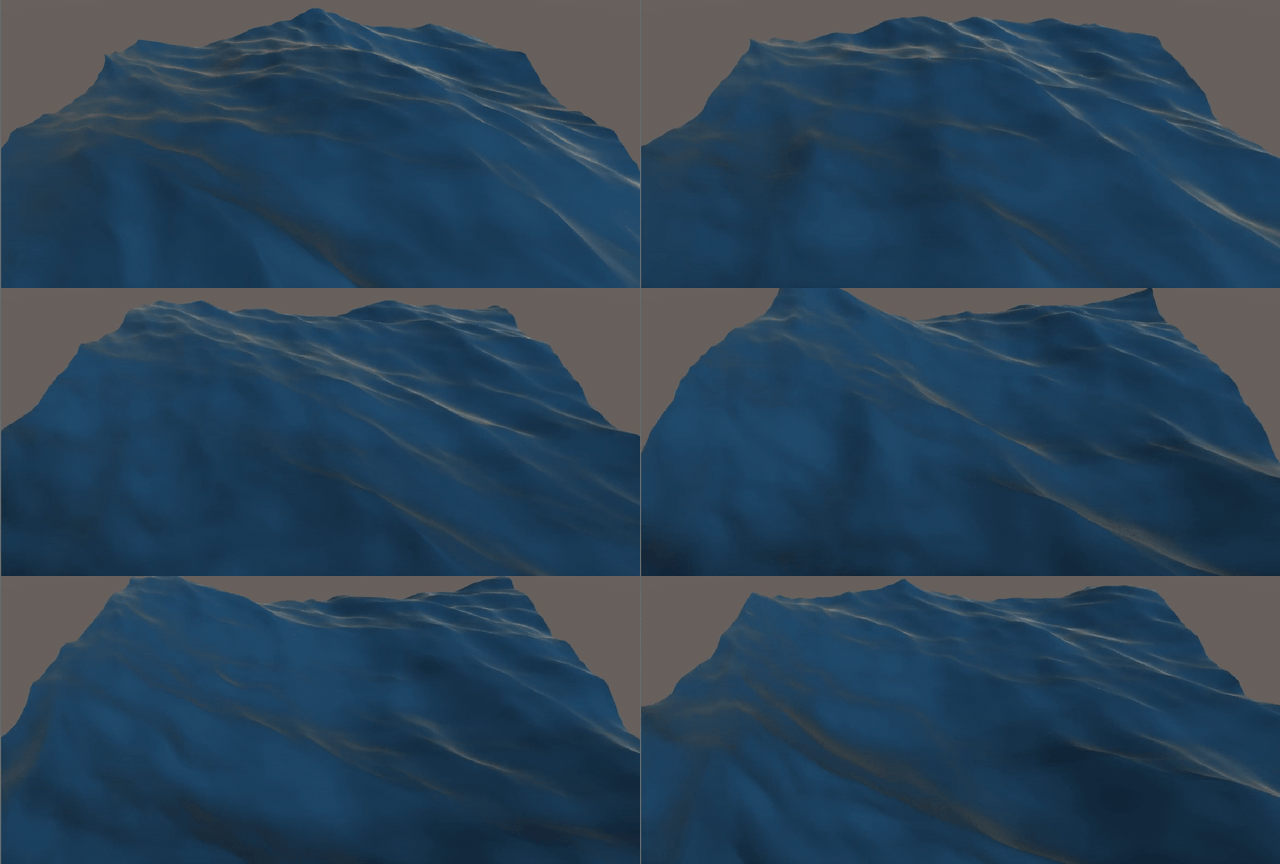
Figure 7: Simulation with illumination effects.
Final result and future work
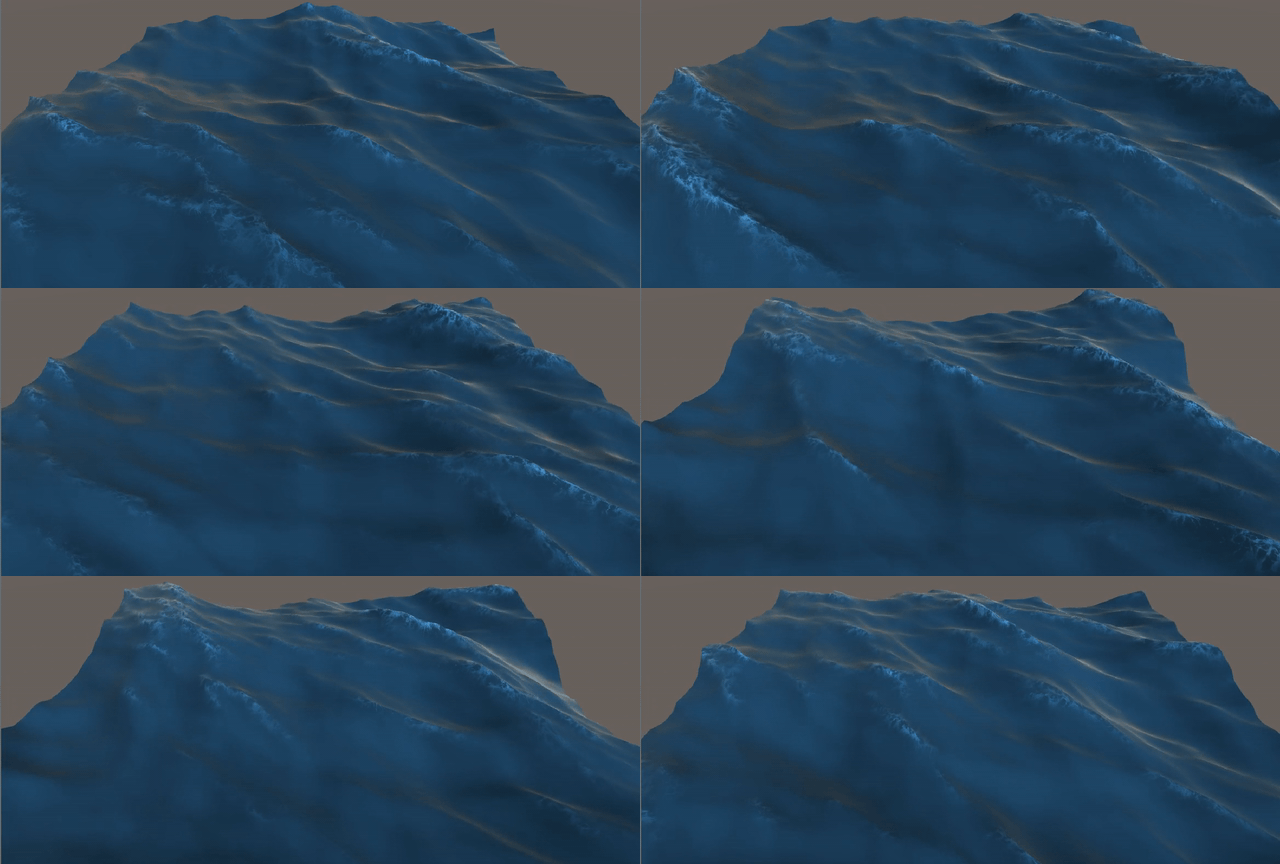
Figure 8: Final result, rendered on a 64x64 grid.
As Figure 8 shows, the whole project runs on a 64x64 grid. It looks good, but the result is much better at high resolution, as in Figure 1. To get there, all the calculations, especially the FFTs, need to move to the GPU in a compute shader to take advantage of its parallelism.
References
- Tessendorf, Jerry. Simulating Ocean Water. In SIGGRAPH 2002 Course Notes #9 (Simulating Nature: Realistic and Interactive Techniques), ACM Press.
- CGDC 2015, Ocean simulation and rendering in War Thunder.